So that you don’t draw the wrong conclusions in decisive market phases.

2 How We Select Opportunities That Are Worth It.
You don’t need a thousand stocks — you need the few that fit your portfolio and your time horizon. That’s why we filter rigorously before technical analysis even comes into play: business model, management, market position, and financials.
Our Screening Is Intentionally Pragmatic: Do we truly understand the company — or are we just investing in a narrative?
- What does the company produce?
- Do we understand it or the products?
- Can the products or the business model be copied?
- Does the company have a dominant market position?
- What is the competitive environment like?
- How is the management set up?
- What do the company’s balance sheets look like?
- What is the company’s outlook, both in terms of figures and market opportunities or risks?
- What does the share price look like? Is the share price ahead of a major price decline, in the middle of one, or at the beginning of a price increase?
3 From Plan to Decision – Inside the Model Portfolio.
A portfolio you can actually follow.
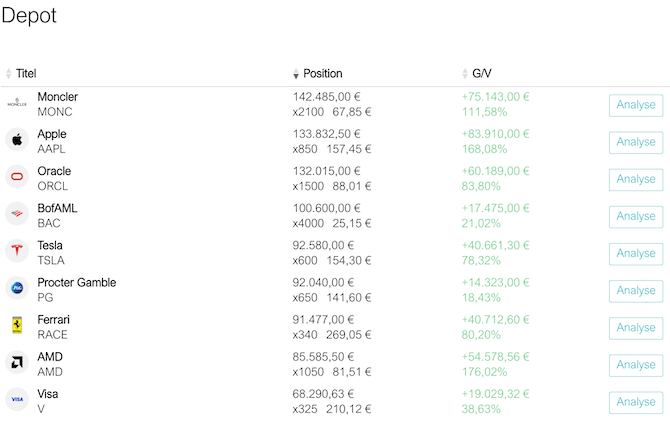
Liberty Stock Markets sample portfolio.
How is the portfolio structured?
Like a real long-term portfolio:
-
as a continuous process, not a one-time bet
-
with no “end point,” but a logic of building, adjusting, and risk management
In the portfolio overview, you can clearly see:
-
which positions are active
-
when adjustments take place
-
and how each decision is justified
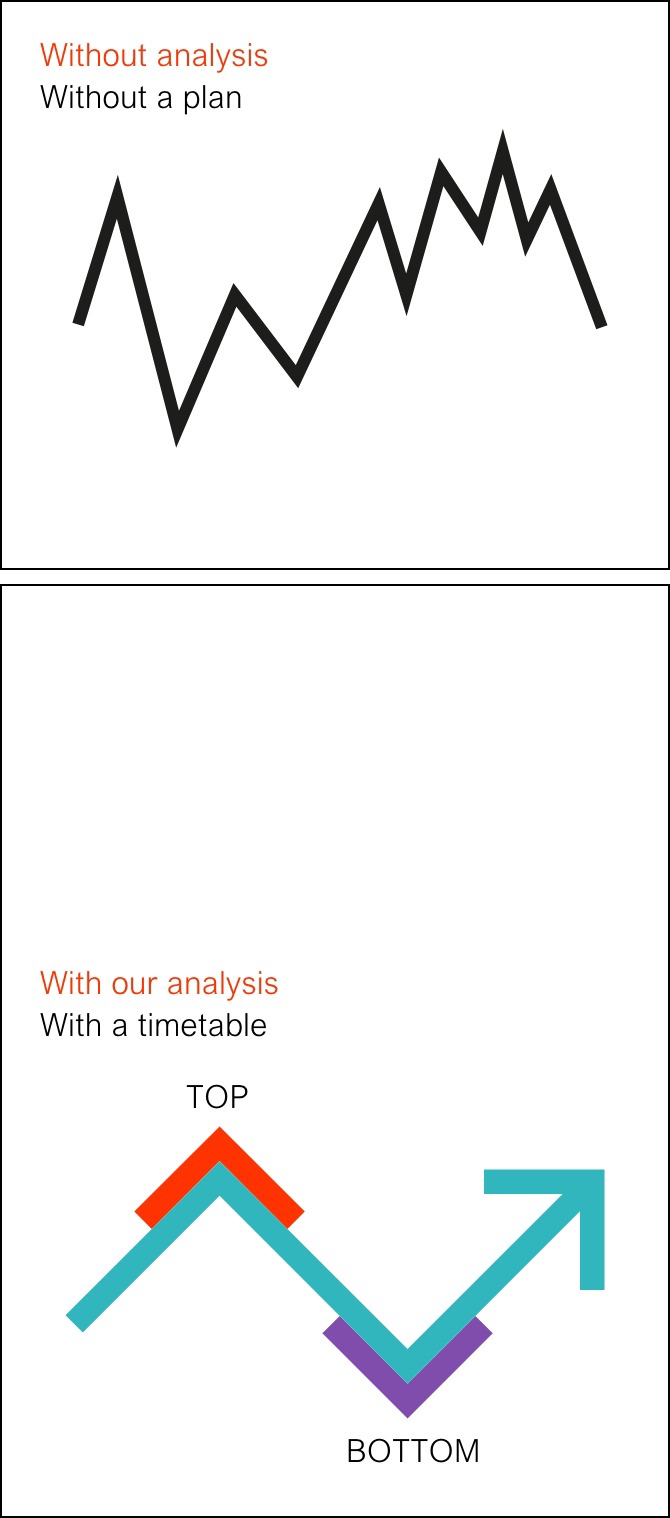
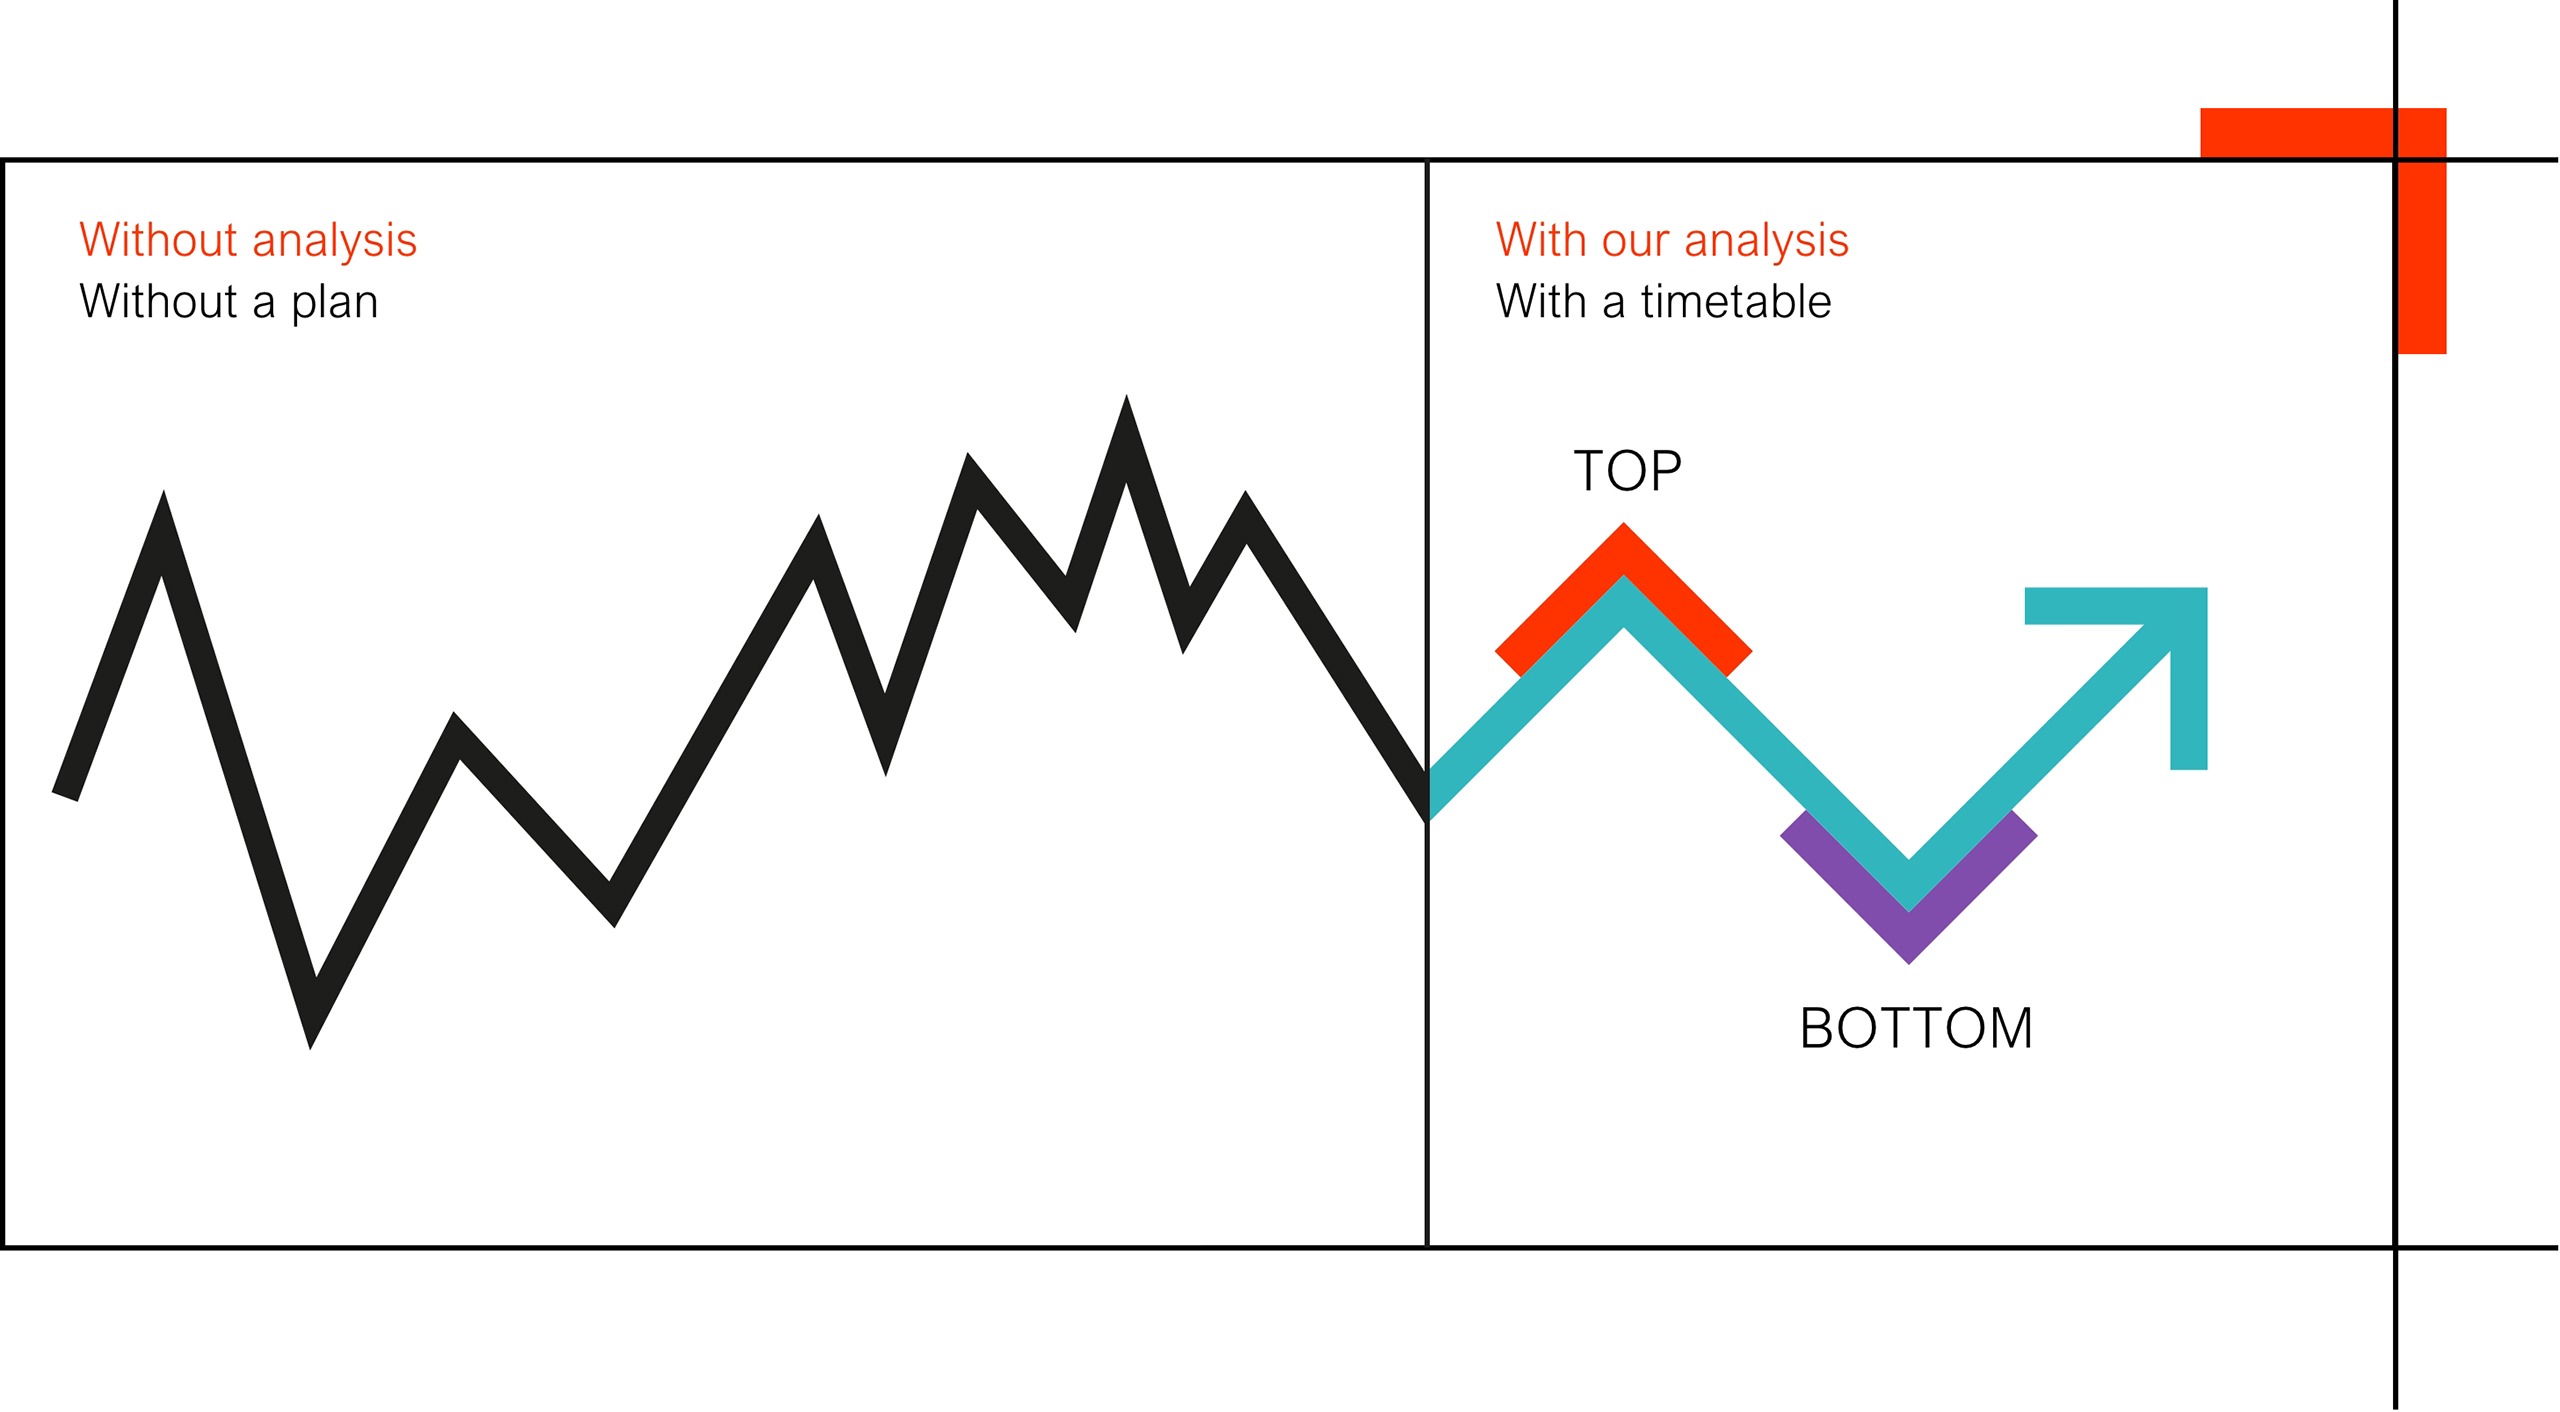
4 Our Forecasts — Turning Price Action into Decision Structure.
From price movement to clarity.
A chart shows only one thing at first: the past.
The decisive step is turning that past into structure for the future.
That’s why Liberty forecasts are not opinions —
they are built on a clear, repeatable framework:
-
Scenario: the most probable path
-
Target zones: areas where decisions are prepared
-
Triggers: confirmation or invalidation — defining when a scenario becomes active
-
Alternative: what applies if the market moves differently than expected
This logic ensures that, in the decisive moment,
you don’t have to guess.
Because Liberty doesn’t protect you from volatility —
Liberty protects you from bad decisions.

6 Watchlist: preparing decisions before they become necessary.
Not every stock is an immediate buy.
But many become interesting before they are truly “ready.”

In the watchlist, we collect assets that we monitor in a structured way — so that a decision is prepared before the market forces it.
The goal is not actionism.
The goal is readiness:
When the time comes, a plan is already in place.
7 rules that prevent wrong decisions.
In the market, most people don’t fail because of missing information — but at the moment of action. That’s why Liberty works with fixed rules for risk, position sizing, and consistency. These rules are not a “textbook.” They are protection against typical thinking errors: reacting too late, acting too early, or reshuffling positions without a plan.